
Colors
Our primary palette leads with our recognizable brand colors of Illinois Tech Red, Gray and Black. Layouts will lean heavily on these colors, but will also mix with the accent palette to build color schemes that are complementary and balanced. The supporting palettes complement the primary palette for use on the website and in print materials. The goal of a complementary palette is to add highlights and color to materials without detracting from the official university colors.

Name: IL Tech Red
Hex:#cc0000

Name: IL Tech Gray
Hex:#76777b

Name: Il Tech Black
Hex:#00000

Name: White
Hex:#ffffff

Secondary Color
Name: Yellow
Hex:#ff9900
Accessibilty
Some people with visual impairments interpret color and contrast differently, making it difficult to access information communicated only by color. Making colors accessible usually means creating color combinations that provide enough contrast that the content is clearly distinguishable from the surrounding page.
|
Background
Text
|
#FFFFFF
|
#CC0000
|
#76777B
|
#FF9900
|
#000
|
|---|---|---|---|---|---|
|
White
#FFFFFF
|
Text
AA
5.8
|
Text
AA18
4.4
|
Text
DNP
2.1
|
Text
AAA
21
|
|
|
IL Tech Red
#CC0000
|
Text
AA
5.8
|
Text
DNP
1.3
|
Text
DNP
2.7
|
Text
AA18
3.5
|
|
|
IL Tech Gray
#76777B
|
Text
AA18
4.4
|
Text
DNP
1.3
|
Text
DNP
2
|
Text
AA
4.7
|
|
|
Yellow
#FF9900
|
Text
DNP
2.1
|
Text
DNP
2.7
|
Text
DNP
2
|
Text
AAA
9.8
|
|
|
#000
|
Text
AAA
21
|
Text
AA18
3.5
|
Text
AA
4.7
|
Text
AAA
9.8
|
|
|
AAA Pass, AAA (7+)
AA Pass, AA (4.5+)
AA18 Pass, Large Text Only (3+)
DNP Does Not Pass
|
|||||
Typography
The Source Sans and Source Serif font family has been chosen not only for its appealing characteristics, but also for its flexibility for both print and web uses. This font family can be used both for body text (Light and Regular weights) and as display/headline text. You can find the fonts for download here:
When creating materials that will be displayed on computers that don’t have this font (i.e. in Microsoft applications), replace with Arial and Georgia.
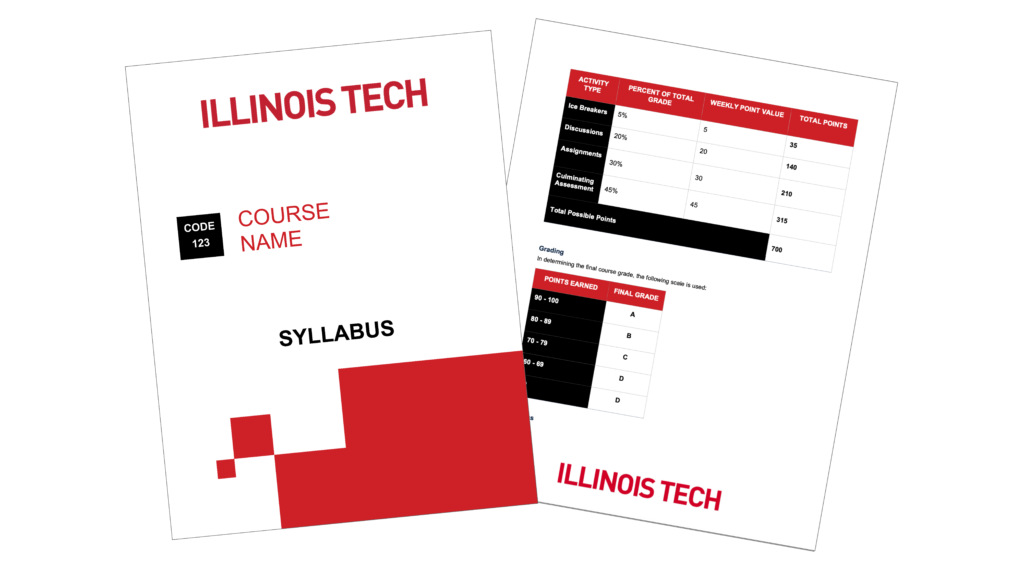
PowerPoint & Word Templates
Click on the links below to download IIT branded PowerPoint and Word templates.
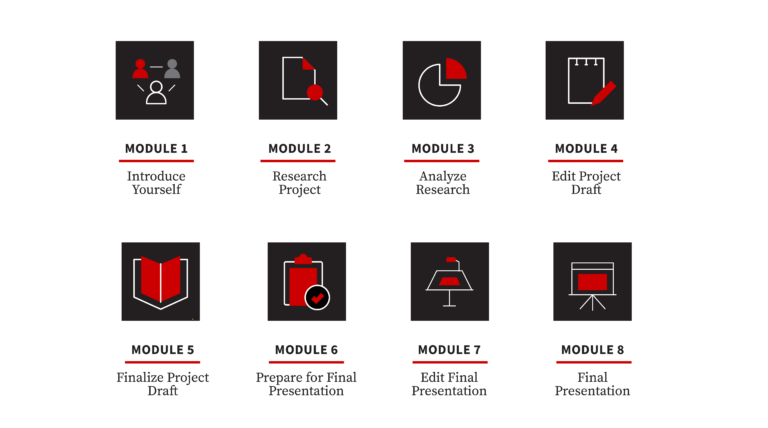
Graphic Style & Iconography
Graphics can be used inside of the course page or videos to facilitate visual storytelling. The use of visuals can emphasize and highlight the practical expression of course content. The illustration style is simple and flat in nature. Colors should match those outlined in the “Type” and “Colors” section of this style guide.
Character Illustration Style
An illustration style has been established as a visual precedent for how characters would be illustrated inside of animations in video and in narrative sequences via images. The illustration style will create consistency with the look and feel across the courses.


Using AI Tools
While AI is an extremely useful tool, we want to make sure that any outputs it produces are as close to the brand guidelines set up for the university as possible. That requires human eyes on all AI outputs. AI is not perfect. This guide will help you determine if an image output is in line with brand guidelines or if it strays too far from what we’ve deemed as acceptable deviations from the brand.
Characters
Characters will be used throughout IIT courses to bring a visual representation of course examples, topics, and themes. In cases where characters are unable to be created by the Risepoint Media team, we’ve created a GPT bot that can create characters for use in courses.
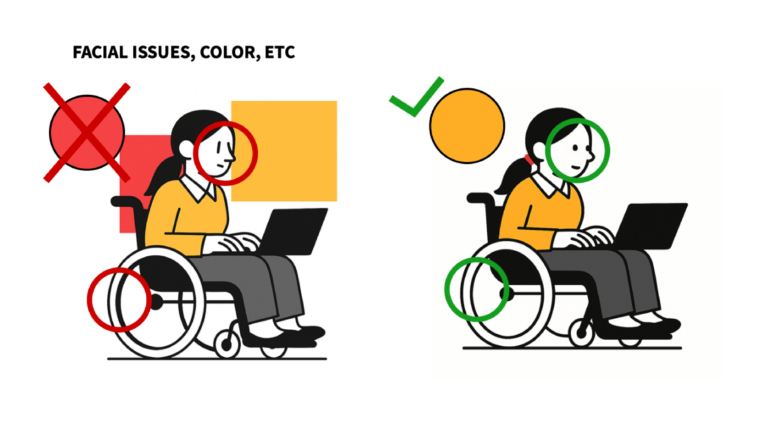
Details to keep in mind when evaluating a GPT output:
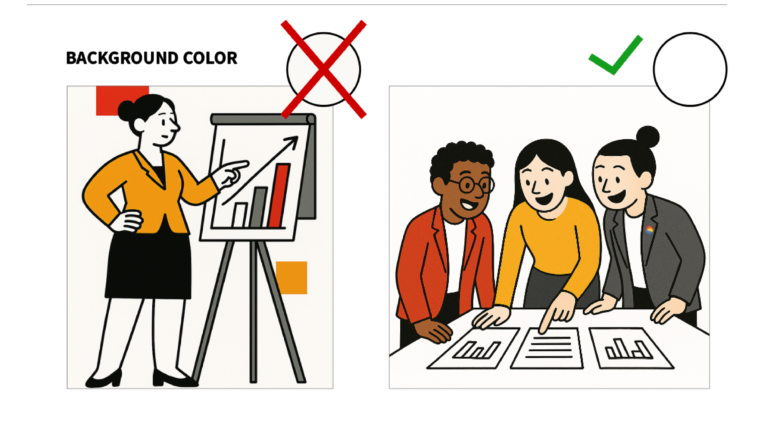
- It has a fully white background
- No issues with facial features, hands, or other character elements
- Black outline is generally a consistent weight Colors (Red and Yellow in particular) are visually close to Brand Colors
- Composition/dimension are appropriate for use (ie: widescreen for video use, etc)
- Diversity and characterization of characters is appropriate (characters can have no skin tone or can have defined skin tones to show diversity more clearly)
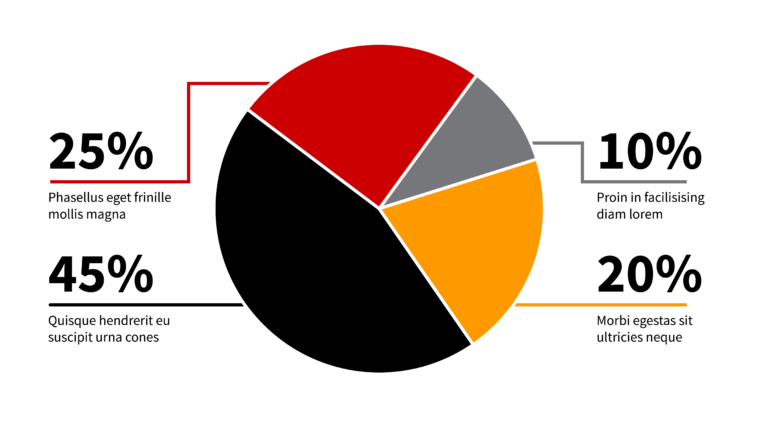
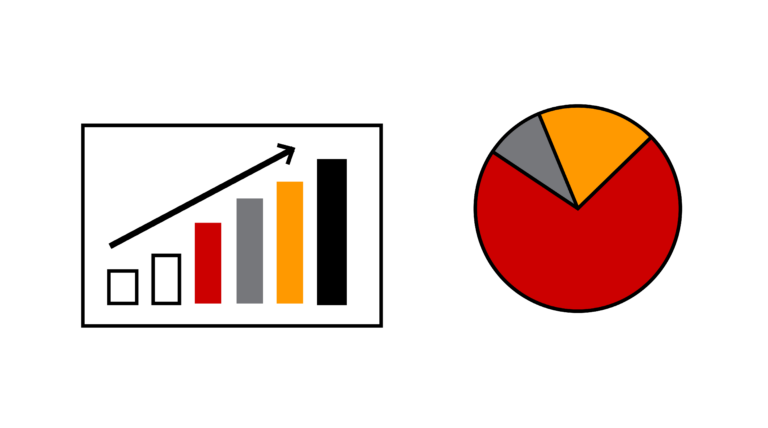
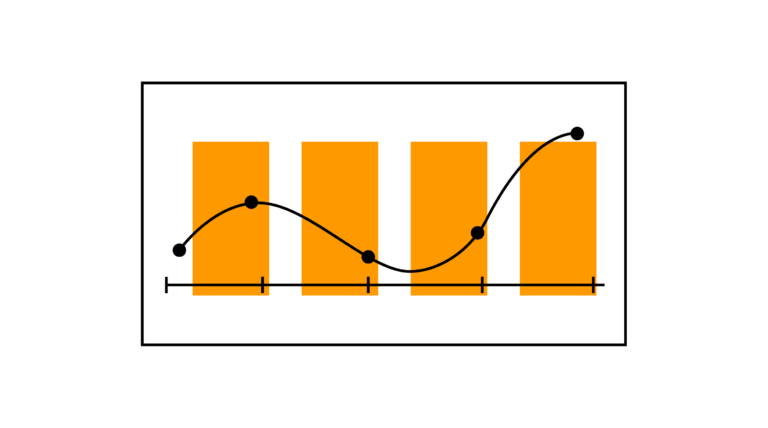
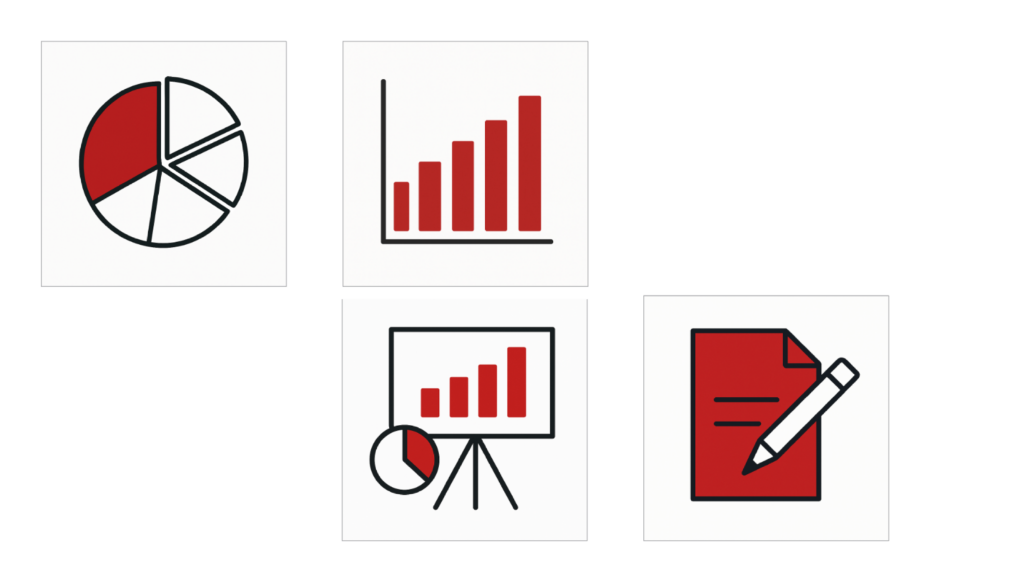
Supplemental Illustrations
For visual representations of concepts or showing generic data visualization examples, we’ve created a separate IIT bot to assist. All notes and details involved in character outputs also apply to these supplemental illustrations.
Keep in mind that in this context, the GPT will NOT be able to accurately represent actual data in a visual format. So any data visualization needs should be kept to more generalized representations of the data (ie, if the data would be shown as a pie chart, line chart, bar chart, etc). Use cases for additional illustrations like these will be reserved for instances within the course where terms/concepts/ ideas need a visual accompaniment (ie a list of tasks, term call-outs, etc).
Troubleshooting Tips
To Get a White Background
If the output does not have a pure white background but all other elements are fine, paste the “character sheet” (generated along with the image) with the added prompt: “–background is pure #FFFFFF white”, and run the GPT again.
To Adjust Colors
If the colors are too far off of the brand colors, paste the “character sheet” with the added prompt: “–all colors use precise hex #CC0000 and #FF9900 colors.”
*You might need to run these several times if this new output doesn’t change the colors OR changes other elements of the characters in a way you’d not prefer. If you still are getting undesirable outputs after running the GPT several times, it can be best to start from scratch with a new prompt.